|
|
|
 |
Aerodynamic and Hydrodynamic Performance |
| Performance Boat design and setup secrets for Recreational tunnels, Offshore Cats, Racing tunnels, Fishing/Utility hulls, Vee and Vee-Pad Hulls, Bass Boats | |
| Home New About Us Technical Articles TBPNews Archives FREE Downloads Research Contact Us | |
|
Testimonials
Reviews
Join TBPNews
Advertise
Search
Buy Now
|
|
|
|
|
| TBDP©/VBDP© Design Compare Analysis | ||
| Get complete article by email request: | Share: | |
| BREAKTHROUGH! | |||
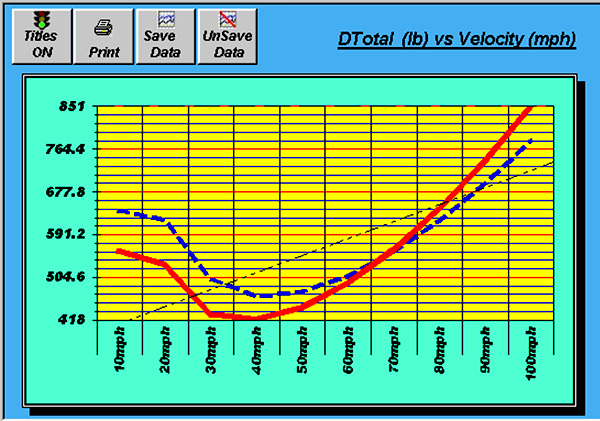 Figure 1- TBDP©/VBDP© Graphic COMPARE feature shows all performance Results - comparing NEW design to BASE design. It's easy to see if your changes result in desired performance improvements. 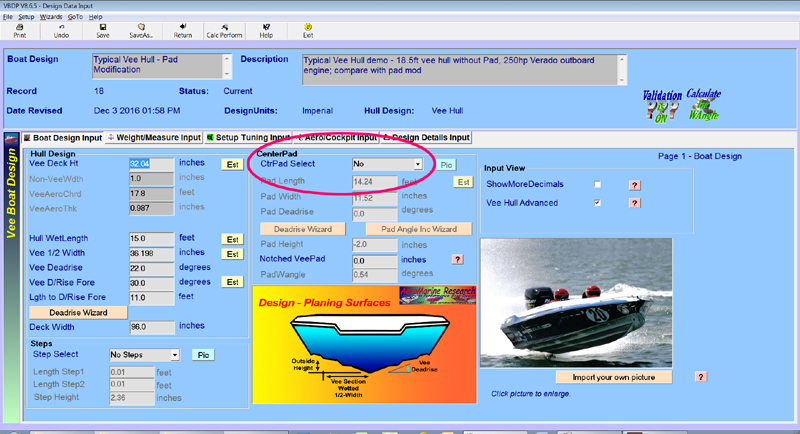 Figure 2 - Easily compare 2 design/setup arrangements. Here is our example that compares a 18ft/250hp standard 22 degree vee hull design to our 'modified' design after adding a 'center pad' to our hull design. 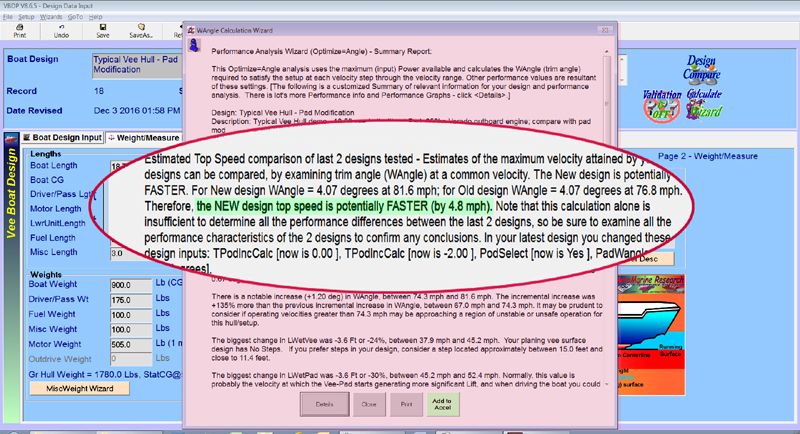 Figure 3- The Custom-Compare Report shows us the 'bottom-line' performance results, comparing the BEFORE and AFTER design/setup configurations. 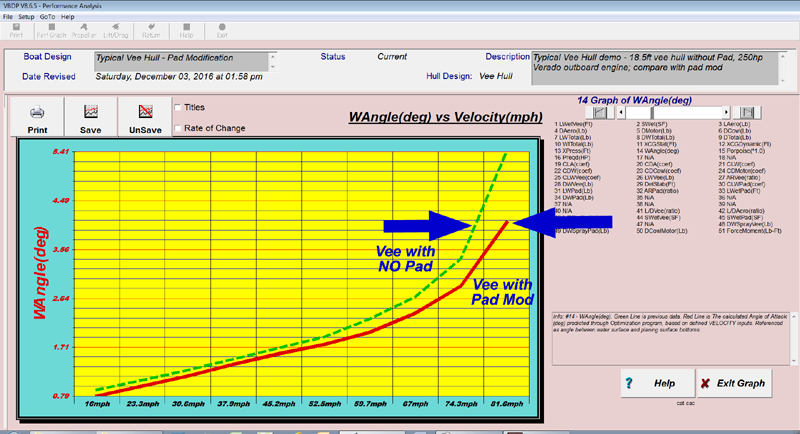 Figure 4-VBDP© 'Performance Compare' Graphic Results, showing different graphs and BEFORE and AFTER comparison of performance data points,through the full velocity range. 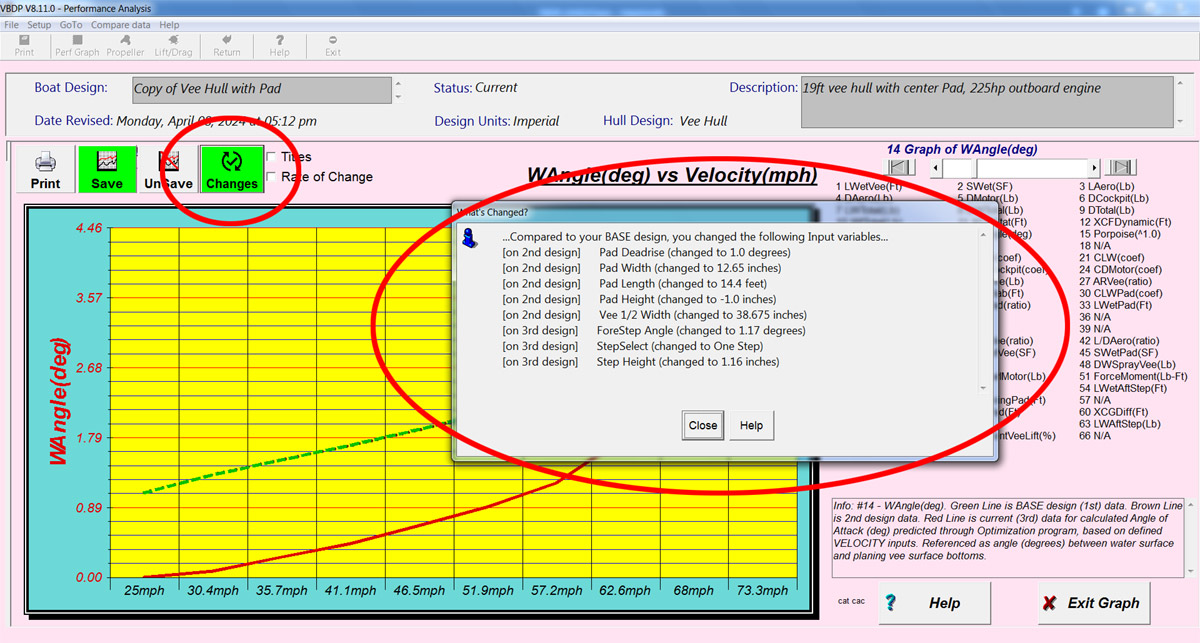 Figure 5-'What's Changed' Wizard shows all design/setup changes made for each design when comparing performance of 2 or 3 designs
VBDP V8 'Design Compare' example - "Vee Pad modification Analysis video "We finally got a chance to sea trial our new 29 ft hull and we got the same speeds as expected from the software. Was really interesting to see how accurate the software was. I would like to thank you for developing such an amazing software to reach our performance goals." [Alby Jacob, Blue Gulf Cat, UAE, Feb 2021] |
A powerful feature of TBDP©/VBDP©
(Version 8) is the 'Design-to-Design Comparison'
feature that allows you to
compare Performance
characteristics of a
'base design' to a
new 'alternative' design(s) or design modification(s). We can easily view, in graphic
format, performance differences between the modified
design/setup and a 'base' design. Making changes (major or minor) can be a tedious, time-consumng and costly effort when implemented on a boat/setup, without knowing whether the resulting performance is going to be as expected or not. TBDP©/VBDP© can complete the performance analysis of a change (or many changes) and display the predicted performance results of the 'design modifications' to the 'base design'. We have developed a powerful 'Performance Analysis Compare' technique that allows designers to see the performance impacts of one or many design/setup changes. The method easily compares the changes to your 'base' design, by presenting all performance results in a graphic format that shows BOTH the 'before' and 'after' design/setup changes. And we can do this for up to 3 design cases! This 'Performance Analysis Compare' technique is useful for any tunnel hull or vee hull design, for changes to any design or setup feature that you'd desire to compare. It's an easy way to 'test' your design/setup modifications BEFORE you make any 'cut' changes to your real boat, or BEFORE you commit your newest design to a final boat! Here's a simple example (see Figure 2 thru Figure 4) of just how easy the 'Performance Analysis Compare' technique is to use in TBDP©/VBDP© software. In our example, we're testing performance changes when we add a 'vee-pad' to our standard 'deep vee' hull design (no pad). When we analyze performance using maximum available power in all analysis cases, then we can view comparative efficiencies in other performance measures (eg: 'WAngle'). Here's the steps we used for our example...
1. Input design & setup features of our 18ft, 250 hp
outboard with standard 22 degree 'deep vee' hull (Figure 2).
How it Works In our Vee-Pad modification example, our 'Custom Compare Report' shows us directly, that our addition of a 'center-pad' to our 'base design' vee hull generates performance results of +4.8mph faster at top speed (Figure 3). In the Performance Graphic Results (Figure 4) screens for the example, we can see the performance comparison through the full operating velocity range (15mph to 82mph), and the differences in all performance characteristics between the 2 compared designs. The 'what's changed' Wizard keeps track of all the design changes made thru our design mod's (Figure 5).
Fine-Tune Base Design Results If you have
actual (real-test) data for the performance of your base design,
this will help you to represent your 'base design' with even
more accuracy. 'Fine-tune' some of your 'estimated' input values
so that your analysis results closely reflect your known
performance analysis results.
[this page updated Aug 16, 2024] |
||
|
Research results now included in performance
analysis by TBDP©/VBDP© [more about AR's research more about AR's publications and technical articles/papers] |
|||
|
© Copyright 2017 by
Jim Russell and AeroMarine Research® - all rights reserved. Material from this website may not be copied or used or redistributed, in whole or in part, without the specific written consent of Jim Russell or AeroMarine Research. |
|||
